揭开粮食不安全背后的故事:用数据创造改变
9 月 27, 2024
Food banks play a critical role in preventing hunger, and they are always looking for ways to serve their communities better. One of the most common questions they ask is how many people in their community may need food assistance. This information can help reveal drivers of food insecurity, guide programmatic decisions, inform advocacy efforts, and more.
However, accurately estimating the level of need in specific service areas is challenging, because population data available varies by geographic level and is not always easily accessible. We’ve created our new Economic Indicators Dashboard in addition to our California Food Insecurity Dashboard, which both display key data to support our food banks and anti-hunger advocates in their work to end hunger in our state.
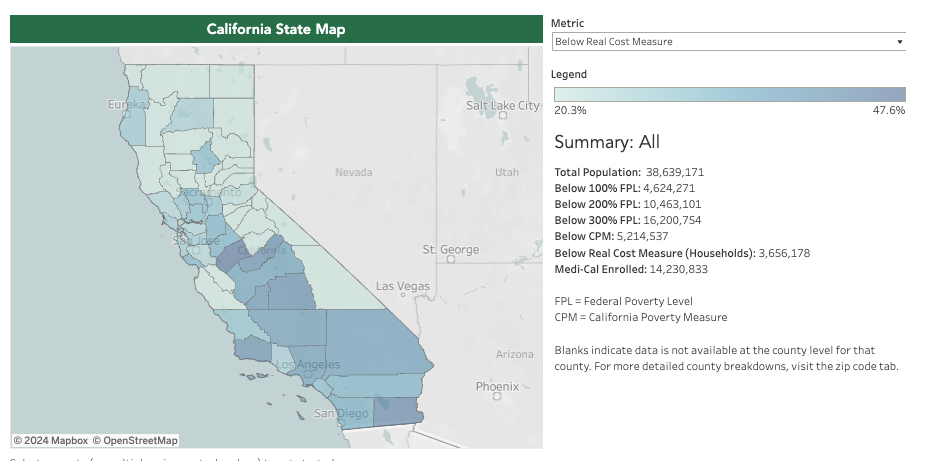
In our newly launched Economic Indicators Dashboard, we’ve mapped out several income-related measures, including the population living under different multipliers of the Federal Poverty Level (FPL), the California Poverty Measure (CPM), and the Real Cost Measure.
Here’s why each of these is important:
Poverty measures are one way of approximating need. The simplest is the Official Poverty Measure (OPM), an estimate of the population living below the FPL. The FPL is set by the federal Department of Health and Human Services and is used to determine eligibility for assistance programs. This threshold varies by household size (e.g., $31,200 for a family of four). However, because it’s a national standard and costs of living are particularly high in California, OPM underestimates economic hardship in our state. The Supplemental Poverty Measure (SPM) and California Poverty Measure (CPM) generate more realistic estimates of poverty by factoring in additional living costs like housing, utilities, and transportation, adjusted by geography. When estimating the poverty rate, SPM and CPM also account for government benefits in addition to income.
Even with regional cost-of-living adjustments, CPM and SPM still do not directly represent the potential need for food assistance. For example, many individuals living above the poverty level can still be food insecure. This is where multipliers of the FPL (e.g., 200% or 300% FPL) can serve as alternative income thresholds to better capture those at risk of food insecurity. A primary benefit of using the FPL or its multipliers is that estimates for people living under these thresholds are readily available at the zip code level.
For food banks looking to pinpoint high-need communities, we’ve included a zip code-level heatmap that displays the population living under 100%, 200%, and 300% of the FPL; viewers can select the FPL multiplier that best reflects the minimum income needed in their area.
Cost-of-living measures such as the Real Cost Measure 和 Self-Sufficiency Standard are another way to approximate potential need. These measures produce more generous income thresholds, with an emphasis on what’s realistically needed to remain self-sufficient, not just stay out of poverty. These thresholds vary by household size and composition and are based on estimated cost-of-living in each county.
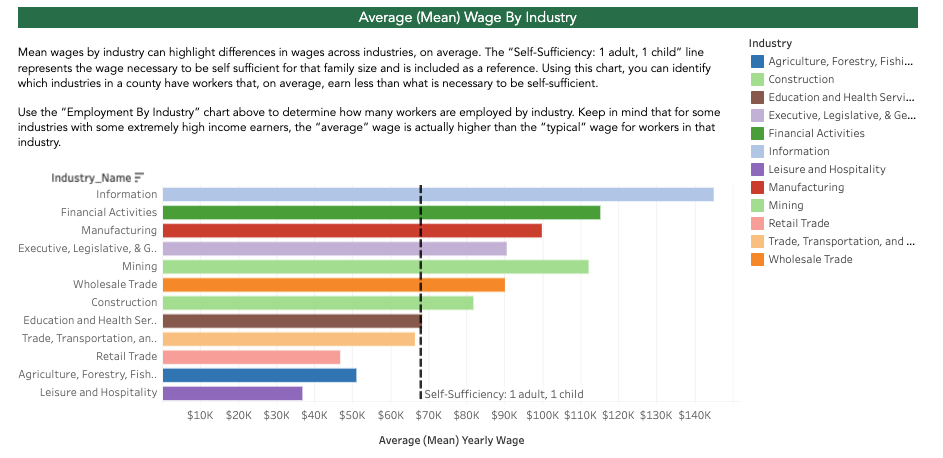
Employment data can also help food banks understand potential need in their community. For instance, a spike in unemployment may precede an influx of new community members utilizing a food distribution. Additionally, the recognition that many workers are in low-paying occupations in a given region may signal a need to expand partnerships with organizations serving these workers. With these uses in mind, we’ve included several employment metrics in our Economic Indicators Dashboard, including unemployment rates, major industries and occupations, and average wages. These data are available for most counties and select metro regions.
Our Food Insecurity Dashboard displays trends in food insecurity across the state and select metropolitan areas starting in 2020. This data comes from the Household Pulse Survey (HPS), a recurring national survey with a question measuring food insufficiency (i.e., whether a household has enough food), which is then converted to an estimated food insecurity rate.
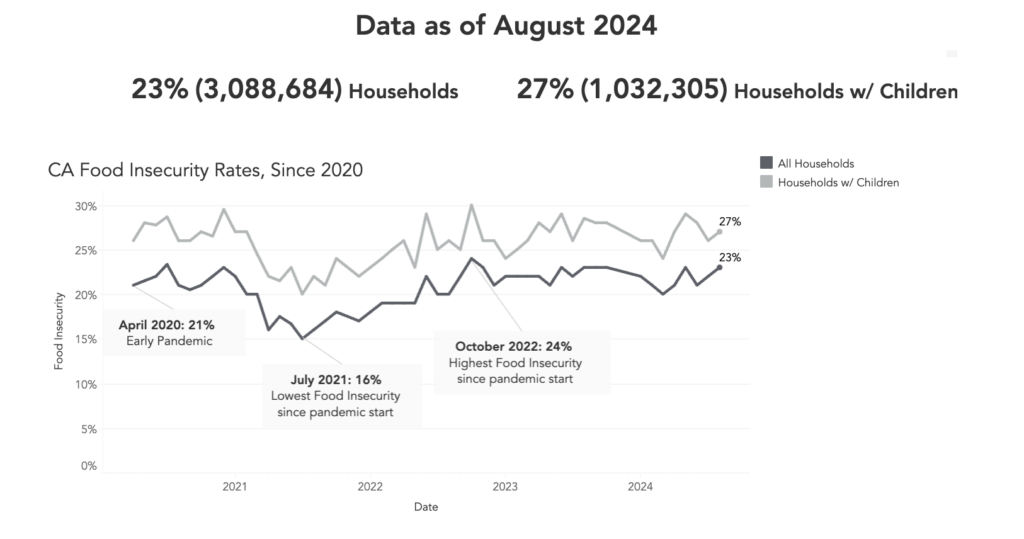
One key advantage of this data source is that it uses a direct measurement of food hardship, i.e., it is not an approximation based on other, related data. It has also been collected frequently and repeatedly since the start of the COVID-19 pandemic, allowing short-term trends to emerge. This has been especially useful for time-sensitive goals such as advocating for State resources.
While October will be the final data release under the current HPS methodology, the data obtained over the last four years has been invaluable. Moving forward, we will be determining an alternate source of statewide data on food security rates.
Ultimately, there is no single measure that can predict or completely capture the need for food assistance in a specific area. But by leveraging diverse data sources, food banks can anticipate trends, target underserved areas, and drive meaningful change in their communities. As new challenges emerge, our commitment to refining these tools and expanding access to accurate, localized data continues to grow stronger. Together, we can focus not just on meeting the present demand for food assistance, but also on ensuring that every effort we make today builds toward a hunger-free tomorrow.
随时与饥饿作斗争。
