Los recortes a la red de seguridad en medio de una alta pobreza agravan la crisis del hambre
27 de septiembre de 2023
No ofrecemos comida. Aquí es donde puedes Encuentre comida gratis aquí.
No distribuimos alimentos. Encuentre comida gratis aquí.
我們不直接提供食物,但我們能幫助您找尋食物。
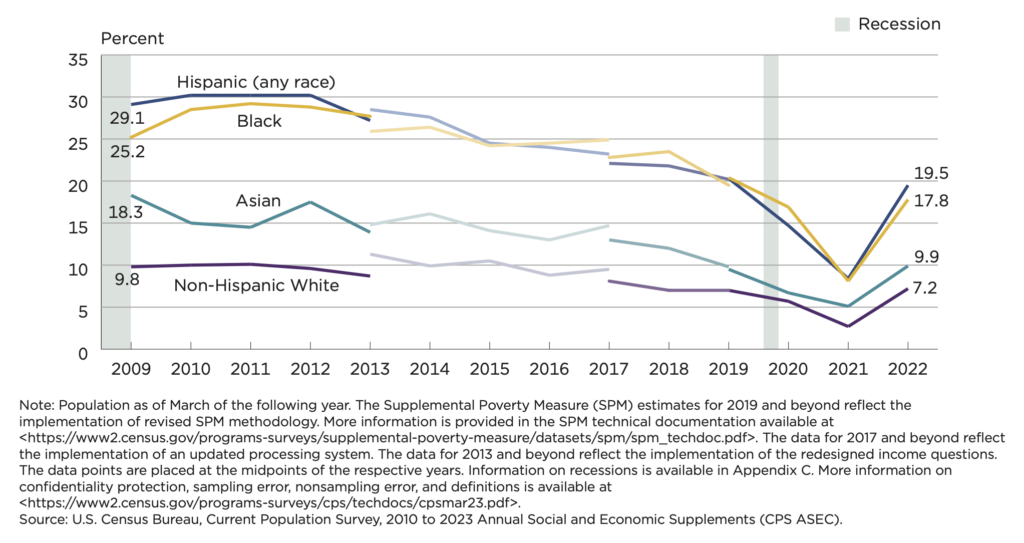
Earlier this month, the U.S. Census Bureau released data showing record-high jumps in poverty between 2021 and 2022. Poverty in the U.S. increased across all age categories, household types, and racial and ethnic groups measured. Especially concerning are the findings that disparities by race and ethnicity dramatically widened — erasing substantial gains that had been made since the pandemic — and that poverty rates among children more than doubled. Experts attribute much of the backsliding to the expiration of pandemic-era economic supports, such as the Child Tax Credit expansion and other safety net programs that ended in 2021.

Poverty and low incomes are the main drivers of food insecurity — the condition of having insufficient or uncertain access to enough food to live a healthy life. Indeed, food banks around the country, including many of our members in California, reported a steady surge in the need for food assistance in 2022, coinciding with the timeframe of the Census data.
Against this backdrop of economic hardship, 2023 has brought even more setbacks to ending hunger in California, with the termination of CalFresh Emergency Allotments in March and a substantial cut in Pandemic-EBT over the summer. These two benefits together represented one-third of the state’s food assistance safety net when they were in place.
Multiple data sources illustrate that the need for food assistance in California has intensified over the past year:
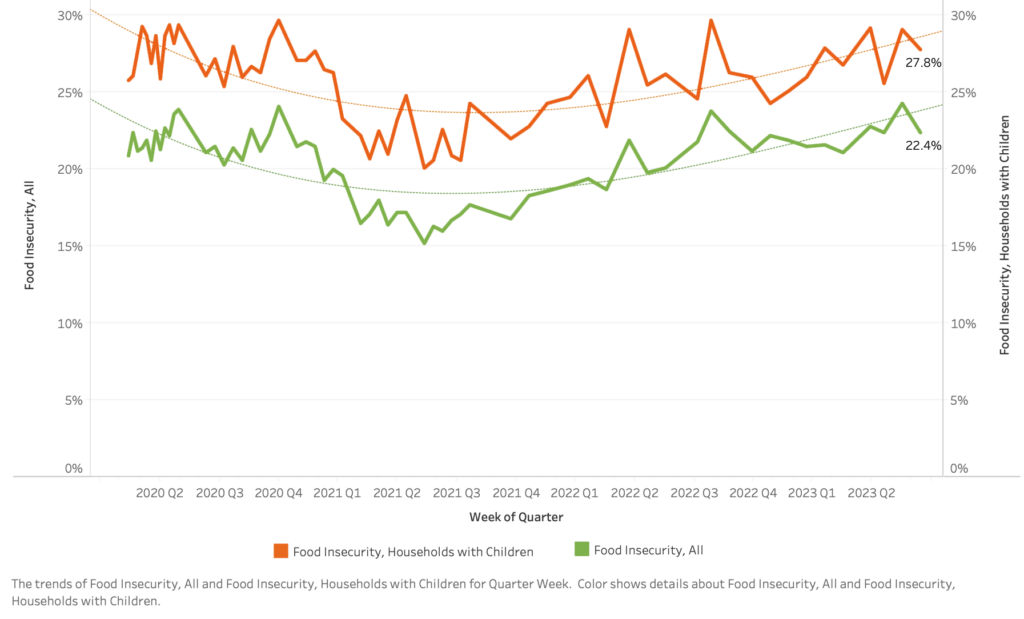
Analyses by Northwestern Institute for Policy Studies of the ongoing Census Household Pulse Survey estimate that, in August 2023, 22% of California households overall and 28% of households with children were food insecure. These rates are comparable to those of 2020, during the early stages of the pandemic, and higher than in 2021 when there had been a brief downward trend.

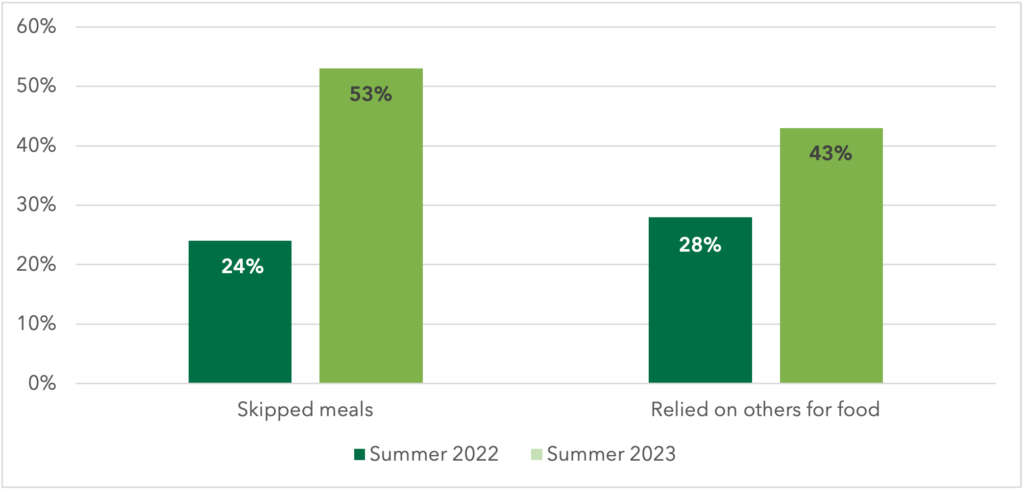
Our partners at Propel, the creators of the Providers app, surveyed CalFresh / SNAP users to understand the impact of cuts in Pandemic-EBT benefits among families by comparing responses from August 2023 — after the decrease — to those of August 2022. Data specific to California show that:

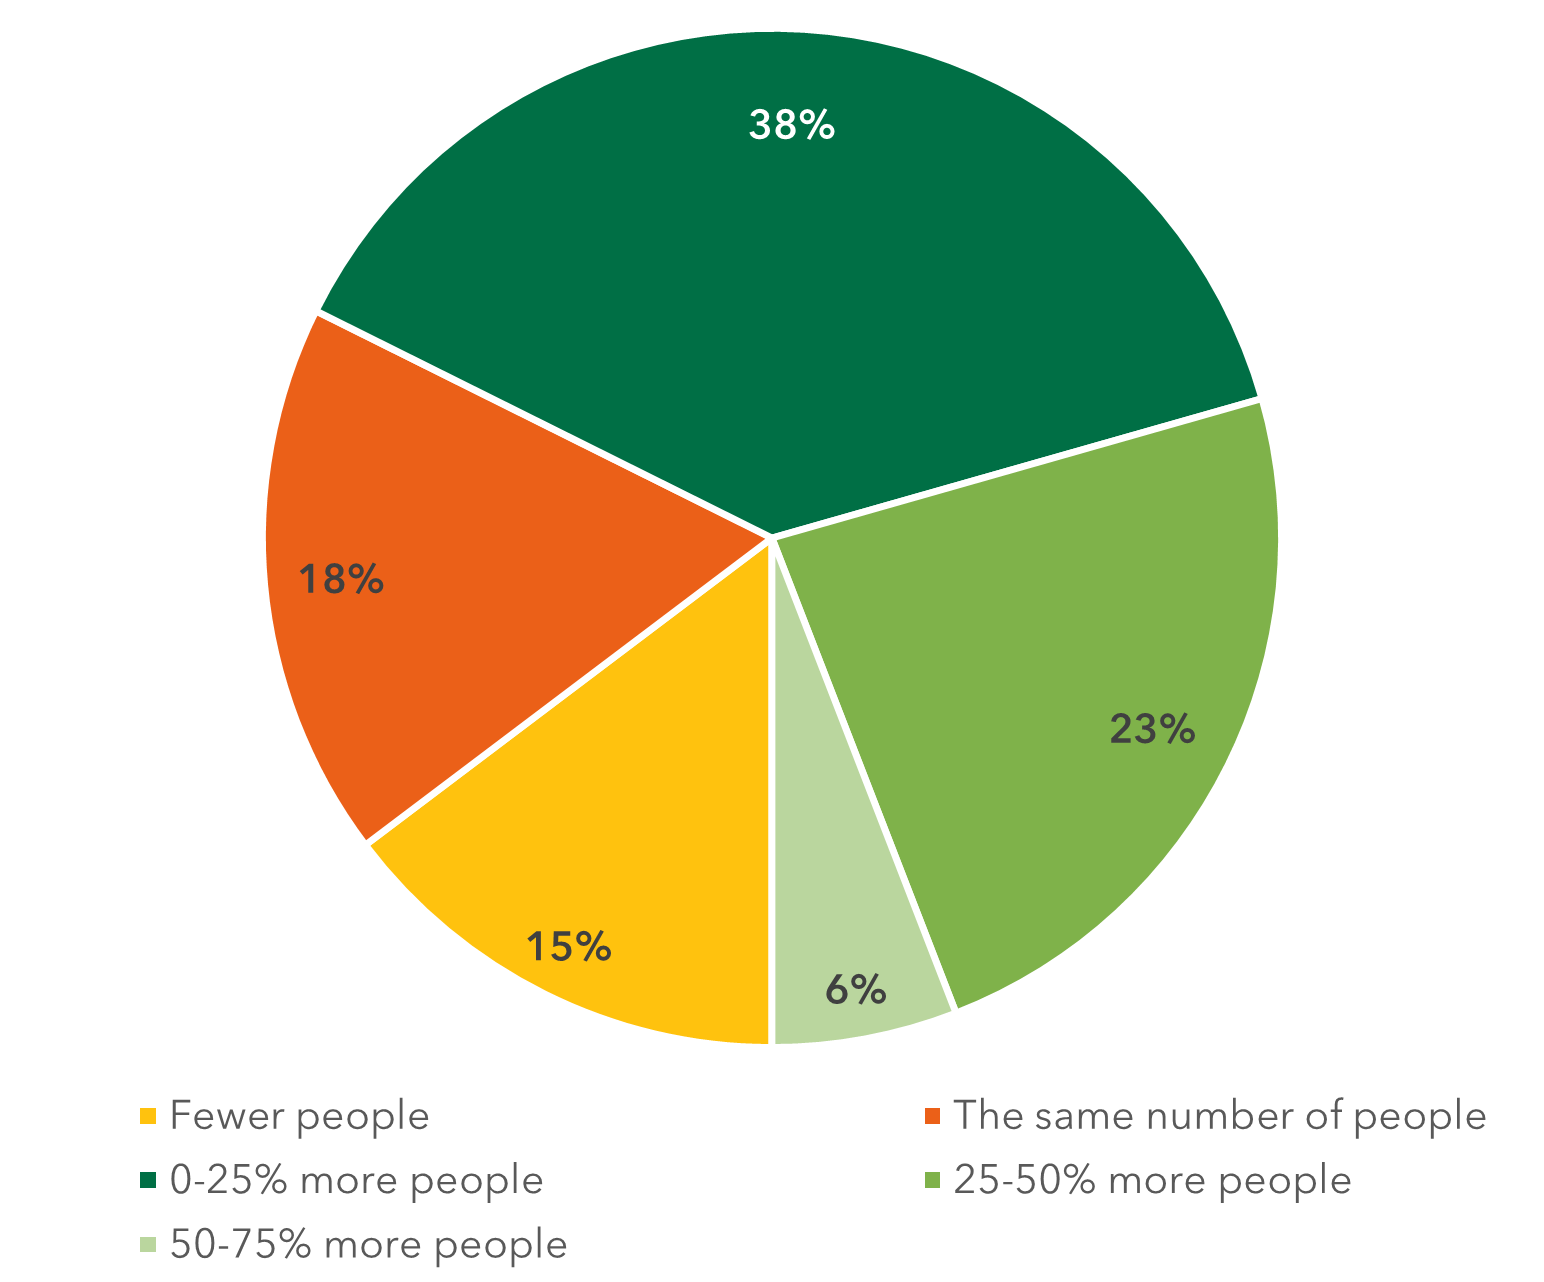
To learn how food banks have been impacted by the end of Emergency Allotments, high inflation, and other conditions, CAFB fielded two “pulse” surveys among our member food banks on the needs they observed in their communities for food assistance and strategies they have used to adapt. Through these surveys, which asked about April and July 2023 respectively, we learned that of the food banks that responded:

Data provided to CAFB by the California Department of Social Services show that CalFresh households lost an average of $183 per month when Emergency Allotments ended in March. Over the summer, CAFB conducted focus groups and interviews with CalFresh outreach workers and community members to understand the life experiences of people receiving CalFresh, the role Emergency Allotments played in their pandemic recovery, and the impact of losing them earlier this year. Data are currently being analyzed and will be shared in the coming months.
We continue to track these and other data to better understand all aspects of food insecurity in California, including the impacts of policy and program changes. We are also developing a resource bank for members and the public to have continuous access to data about food insecurity and other forms of economic hardship.